
With the ever-evolving digital landscape, newsrooms are continuously looking for ways to optimize their content and user experience to meet the demands of their audience. Google Analytics 4 (GA4) offers a plethora of metrics to track and analyze user behavior, making it a vital tool for newsrooms to stay ahead in the game.
User Engagement Metrics
Engagement metrics are crucial for newsrooms as they reveal the effectiveness of your content in capturing your audience's attention. These metrics help you gauge how users interact with your content, and how long they stay on your website. Key user engagement metrics to track are:
Pages per Session: This metric measures the average number of pages viewed during a session. A higher value indicates that users are exploring more content on your website, which is a positive sign.
Average Session Duration: This metric reflects the average time users spend on your website. A longer session duration indicates that users find your content valuable and are more likely to remain engaged.
Bounce Rate: The bounce rate measures the percentage of users who leave your website after viewing just one page. A high bounce rate suggests that your content is not meeting user expectations, and improvements may be necessary.
Scroll Depth: Scroll depth shows how far users scroll down on a page. Tracking this metric helps you understand how much of your content users consume and can guide content length and placement decisions.
Acquisition Metrics
Acquiring new users is essential for newsrooms to expand their audience base and increase their reach. Acquisition metrics give you insights into how users find your website and which channels drive the most traffic. Important acquisition metrics to track are:
Traffic Channels: This metric breaks down your website traffic into different channels such as Organic Search, Direct, Referral, Social, and Email. Understanding which channels drive the most traffic can help you focus your marketing efforts more effectively.
New vs. Returning Users: By comparing the ratio of new users to returning users, you can gauge the effectiveness of your content and user retention strategies.
Top Landing Pages: Identifying the most popular landing pages on your website allows you to understand which content pieces are attracting users and driving engagement.
Demographic Metrics
Understanding your audience demographics can help you tailor your content to better serve their needs and preferences. Key demographic metrics to consider tracking are:
Age and Gender: Tracking users' age and gender distribution can help you create content that appeals to your target audience.
Geographic Location: This metric provides insights into the countries, regions, and cities from which your users originate. Knowing your audience's location can help you localize content, adjust publishing times, and target regional issues effectively.
Device and Browser Metrics
With users accessing your website from various devices and browsers, it's important to ensure a seamless experience across all platforms. Tracking device and browser metrics can help you identify potential issues and optimize your website's performance. Metrics to monitor include:
Device Category: Understanding the distribution of users across desktop, mobile, and tablet devices can help you prioritize your development efforts and ensure optimal user experience on all platforms.
Browser and Operating System: Tracking browser and operating system metrics can help you identify potential compatibility issues and optimize your website for the most popular options among your audience.
Conversion Metrics
For newsrooms looking to monetize their content or grow their subscriber base, tracking conversion metrics is essential. These metrics can help you measure the success of your conversion goals and optimize your strategy. Key conversion metrics include:
Goal Conversion Rate: This metric measures the percentage of sessions that resulted in the completion of a specific goal, such as newsletter sign-ups or subscription purchases. A higher conversion rate indicates the effectiveness of your calls-to-action and overall website design.
Goal Completions: This metric tracks the total number of times a specific goal was completed by users. Monitoring goal completions can help you gauge the success of your marketing campaigns and identify areas for improvement.
Goal Value: Assigning a monetary value to each goal completion can help you measure the financial impact of your conversions. This metric allows you to assess the ROI of your marketing efforts and make data-driven decisions on where to allocate your resources.
Content Performance Metrics
Analyzing content performance is crucial for newsrooms to understand which topics resonate with their audience and drive engagement. Key content performance metrics include:
Page Views: This metric measures the total number of views a specific page has received. High page views indicate that users find the content interesting and shareable.
Unique Page Views: Unique page views represent the number of sessions in which a specific page was viewed at least once. This metric helps you understand the true reach of your content.
Average Time on Page: This metric shows the average time users spend on a particular page. A longer time on page suggests that users are engaged with the content and find it valuable.
User Behavior Flow
User Behavior Flow is a valuable feature in Google Analytics 4 that allows newsrooms to visualize and analyze how users navigate through their websites. This report provides a clear understanding of the most common user journeys, enabling you to identify areas of improvement, optimize content, and enhance the overall user experience.
Understanding the User Behavior Flow Report
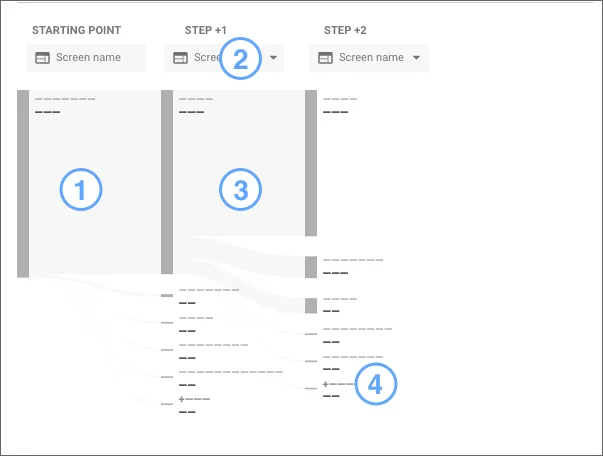
The User Behavior Flow report presents data in the form of a flowchart, illustrating the paths users take when navigating through your website. The report displays a series of nodes and connections, with nodes representing pages or events and connections showing the transition from one node to another.
Key elements of the User Behavior Flow report include:
- Starting Nodes: These nodes indicate where users enter your website. The most common starting points are landing pages, which can be articles, homepages, or category pages.
- Interaction Nodes: These nodes represent the subsequent pages or events users visit or interact with after the starting point. Interaction nodes can include article pages, video plays, or other engagement events.
- Drop-off Points: These points show where users exit your website, providing insights into potential bottlenecks or areas where users lose interest.
Analyzing User Behavior Flow for Optimization
By closely examining the User Behavior Flow report, newsrooms can identify trends and patterns in user behavior that can inform optimization efforts. Consider the following when analyzing the report:
- Popular Paths: Identify the most common user journeys and optimize these paths to ensure a seamless user experience. Focus on creating engaging content, providing clear navigation, and reducing page load times to keep users engaged.
- Bottlenecks: Look for areas where users are frequently dropping off or encountering difficulties in navigating. These bottlenecks could indicate issues with website design, content quality, or technical problems that need addressing.
- High-Performing Content: Determine which pages or events are attracting and retaining users. Use this information to create similar content or promote these pages more prominently on your website.
- Underperforming Content: Identify pages or events with low engagement or high drop-off rates. Analyze these pages to understand potential issues and implement improvements, such as updating content, enhancing readability, or addressing technical problems.
Segmenting User Behavior Flow
To gain more granular insights into user behavior, segment the User Behavior Flow report based on specific dimensions, such as user demographics, acquisition channels, or device types. By segmenting the report, newsrooms can uncover unique trends and patterns among different user groups, helping to tailor content and user experience more effectively. For example:
- Demographic Segmentation: Analyze user behavior flow for different age groups or gender to identify variations in content preferences and user journeys. Use this information to create content that appeals to specific audience segments.
- Acquisition Channel Segmentation: Segment the report by acquisition channels (e.g., organic search, social media, or referrals) to understand how users from different sources interact with your website. Optimize your marketing efforts accordingly to improve user acquisition and retention.
- Device Type Segmentation: Examine user behavior flow for desktop, mobile, and tablet users to identify any device-specific issues or trends. This analysis can inform decisions on website design, content formatting, and technical optimizations for a seamless experience across all platforms.
As the digital landscape continues to evolve, newsrooms must leverage tools like Google Analytics 4 to stay competitive and deliver the best possible user experience. By tracking the aforementioned metrics, newsrooms can gain valuable insights into user behavior, content performance, and website optimization. Ultimately, this data-driven approach will help newsrooms make informed decisions, refine their content strategies, and maximize audience engagement.
